
I have been using TekSavvy since February 2013, almost 10 years. Generally, I have been delighted by the service until the past month.
In the past month, I’ve been having trouble getting to websites and repeating the attempt multiple times. Success can take minutes. Just downloading from Epic Games to update a game is taking forever. This is nowhere near 300Mbps or even a decent fraction. The attempt reports regular messages of having issues connecting. Steam similarly has regular failures but is more robust at retrying.
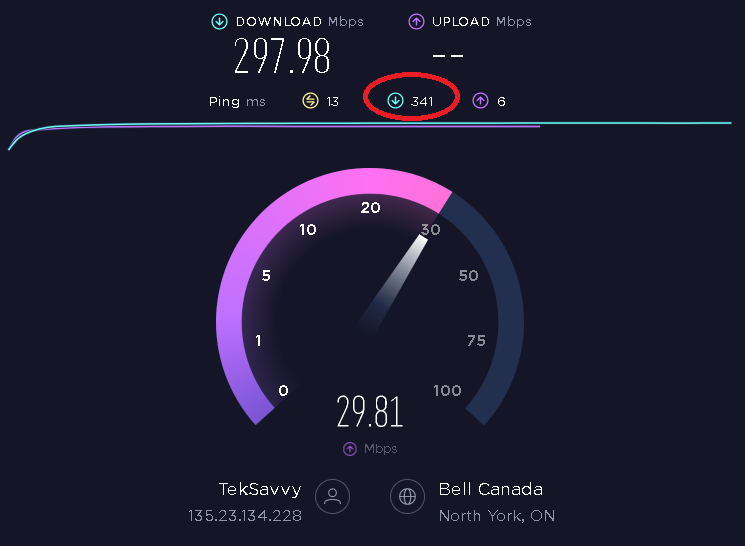
Here is what is interesting: with my laptop connected directly to the modem (configured as pass-thru, so it only does PPPoE as I have a Cisco Meraki router behind it), speedtest.net reports my cable connection has the expected speeds of almost 300 Mbps down and almost 30 Mbps up. The ping is 10-15ms. But the latency ends up going up into the 500s. If I run the speed test and attempt to ping in the background, pings take upward of a second.
I have been working with TekSavvy to fix this, but it has turned into a conflict between Rogers and TekSavvy. Rogers has come twice and confirmed the signal strength is good but added a filter anyway. I have replaced the modem at just shy of $200—still no difference.
Here is a collection of tests run, all directly from a laptop connected to the modem, with no other hardware in the way.
Ping
Here is my ping result connecting to google.ca. I started the ping and then ran the speed test in the background:
ping -4 -n 50 google.ca

Pinging google.ca [142.251.41.35] with 32 bytes of data:
Reply from 142.251.41.35: bytes=32 time=14ms TTL=117
Reply from 142.251.41.35: bytes=32 time=18ms TTL=117
Reply from 142.251.41.35: bytes=32 time=17ms TTL=117
Reply from 142.251.41.35: bytes=32 time=12ms TTL=117
Reply from 142.251.41.35: bytes=32 time=12ms TTL=117
Reply from 142.251.41.35: bytes=32 time=21ms TTL=117
Reply from 142.251.41.35: bytes=32 time=11ms TTL=117
Reply from 142.251.41.35: bytes=32 time=89ms TTL=117
Reply from 142.251.41.35: bytes=32 time=346ms TTL=117
Reply from 142.251.41.35: bytes=32 time=564ms TTL=117
Reply from 142.251.41.35: bytes=32 time=622ms TTL=117
Reply from 142.251.41.35: bytes=32 time=600ms TTL=117
Reply from 142.251.41.35: bytes=32 time=585ms TTL=117
Reply from 142.251.41.35: bytes=32 time=613ms TTL=117
Reply from 142.251.41.35: bytes=32 time=635ms TTL=117
Reply from 142.251.41.35: bytes=32 time=611ms TTL=117
Reply from 142.251.41.35: bytes=32 time=724ms TTL=117
Reply from 142.251.41.35: bytes=32 time=772ms TTL=117
Reply from 142.251.41.35: bytes=32 time=547ms TTL=117
Reply from 142.251.41.35: bytes=32 time=894ms TTL=117
Reply from 142.251.41.35: bytes=32 time=960ms TTL=117
Reply from 142.251.41.35: bytes=32 time=959ms TTL=117
Reply from 142.251.41.35: bytes=32 time=13ms TTL=117
Reply from 142.251.41.35: bytes=32 time=28ms TTL=117
Reply from 142.251.41.35: bytes=32 time=46ms TTL=117
Reply from 142.251.41.35: bytes=32 time=20ms TTL=117
Reply from 142.251.41.35: bytes=32 time=20ms TTL=117
Reply from 142.251.41.35: bytes=32 time=15ms TTL=117
...
Trace Route without Saturation
This test has no speed test running in the background.
tracert -4 google.ca

Tracing route to google.ca [142.251.41.35]
over a maximum of 30 hops:

  1    12 ms    12 ms    11 ms  135-23-134-225.cpe.pppoe.ca [135.23.134.225]
  2    12 ms    13 ms    11 ms  newkirk.rcable-tsi.tor.teksavvy.com [104.195.128.90]
  3    17 ms    13 ms    13 ms  newkirk.tsi-rcable.tor.teksavvy.com [104.195.128.89]
  4    15 ms    13 ms    25 ms  ae4-0-bdr01-tor.teksavvy.com [206.248.155.94]
  5    17 ms    11 ms    18 ms  ae8-0-bdr01-tor2.teksavvy.com [206.248.155.9]
  6    15 ms    14 ms    14 ms  142.250.166.168
  7    15 ms    14 ms    14 ms  74.125.244.145
  8    15 ms    16 ms    13 ms  216.239.49.189
  9    13 ms    13 ms    11 ms  yyz12s08-in-f3.1e100.net [142.251.41.35]
Trace Route with Saturation
This test does have the speed test running in the background, but the speed test completed before the traceroute did.
tracert -4 google.ca

Tracing route to google.ca [142.251.41.35]
over a maximum of 30 hops:

  1   309 ms   451 ms   531 ms  135-23-134-225.cpe.pppoe.ca [135.23.134.225]
  2     *        *      736 ms  newkirk.rcable-tsi.tor.teksavvy.com [104.195.128.90]
  3   915 ms   866 ms   872 ms  newkirk.tsi-rcable.tor.teksavvy.com [104.195.128.89]
  4   951 ms    21 ms    17 ms  ae4-0-bdr01-tor.teksavvy.com [206.248.155.94]
  5   148 ms    70 ms    99 ms  ae8-0-bdr01-tor2.teksavvy.com [206.248.155.9]
  6    29 ms    32 ms    31 ms  142.250.166.168
  7    16 ms    20 ms    21 ms  74.125.244.145
  8    34 ms    31 ms    35 ms  216.239.49.189
  9    22 ms    14 ms    14 ms  yyz12s08-in-f3.1e100.net [142.251.41.35]
Next Steps
I have replaced the modem, and Rogers has been here twice to investigate. So it is either Rogers or TekSavvy. To make that determination, I am now switching my internet provider. If it fixes the problem, the problem is at TekSavvy. If it doesn’t, it is Rogers.
Follow Up
I posted this to Twitter, and TekSavvy is being more responsive but still heavily deflecting from the possibility of being a possible cause.
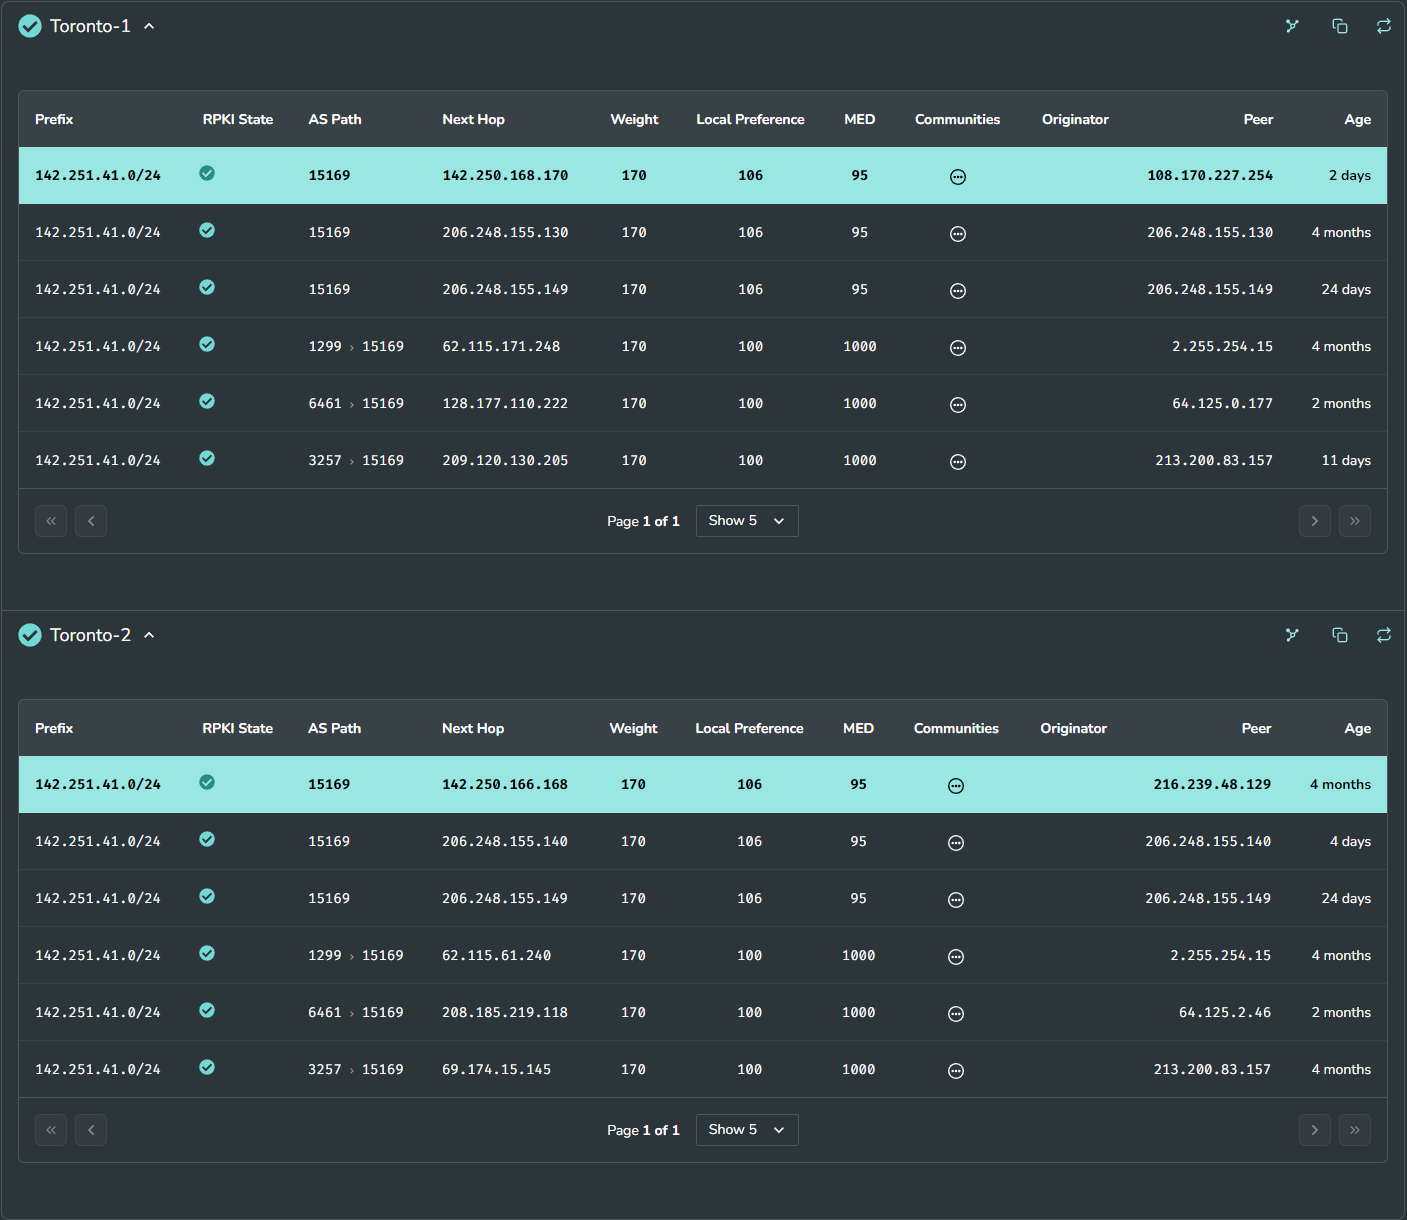
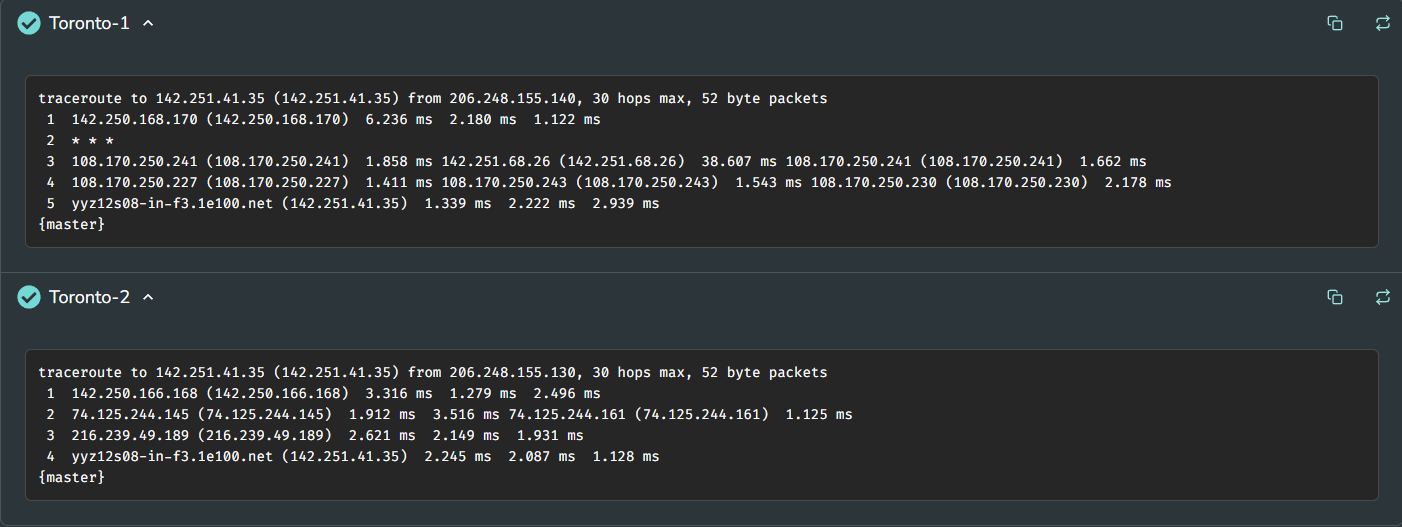
They pointed me to lg.teksavvy.com where I got the following results for hitting google.ca using Tor1 and Tor2:
Since ping and tracert seem fine without traffic but they fails when there is network traffic. This does not indicate there isn’t a problem in TekSavvy data center.